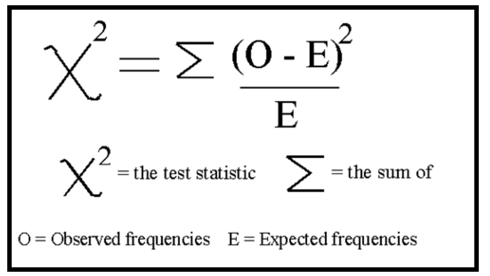
Calculate the Test Statistic: {max-width: 300px, display: block, margin: 0 auto, border: 5px solid black}
Find the P-Value:
Let a statistical tool or software calculate the p-value based on the test statistic and degrees of freedom.
Compare the P-Value to the Significance Level (( \alpha )):
If ( P < \alpha ) (e.g., 0.05): Statistically significant (reject the null hypothesis).
If ( P \geq \alpha ): Not statistically significant (fail to reject the null hypothesis).
Conclusion:
Statistically significant results suggest the observed differences are unlikely due to chance.
Example:
Test Statistic: ( \chi^2 = 10.8 ).
Degrees of Freedom: 3.
P-value: 0.013.
Conclusion: ( P < 0.05 ), so the result is statistically significant.
Questions:
Inputs to Get P Value
How to Get the P-Value in a Chi-Square Test
The P-value in a Chi-Square test tells you the probability of observing your results (or something more extreme) if the null hypothesis is true. A smaller P-value suggests the observed differences are unlikely due to chance.
Steps to Calculate the P-Value
Calculate the Chi-Square Statistic (( \chi^2 )):
Use the formula:
χ² = Σ [(O - E)² / E]
where:
( O ): Observed value.
( E ): Expected value.
Determine Degrees of Freedom (df):
For one variable:
df = (number of categories - 1)
For contingency tables:
df = (rows - 1) × (columns - 1)
Use Software or a Chi-Square Table to Find the P-Value:
Input ( \chi^2 ) and df into statistical software or look up the P-value in a Chi-Square table.
Compare the P-value to the significance level (( \alpha )).
 {max-width: 300px, display: block, margin: 0 auto, border: 5px solid black}