Are scary but very unlikely to cause your death.
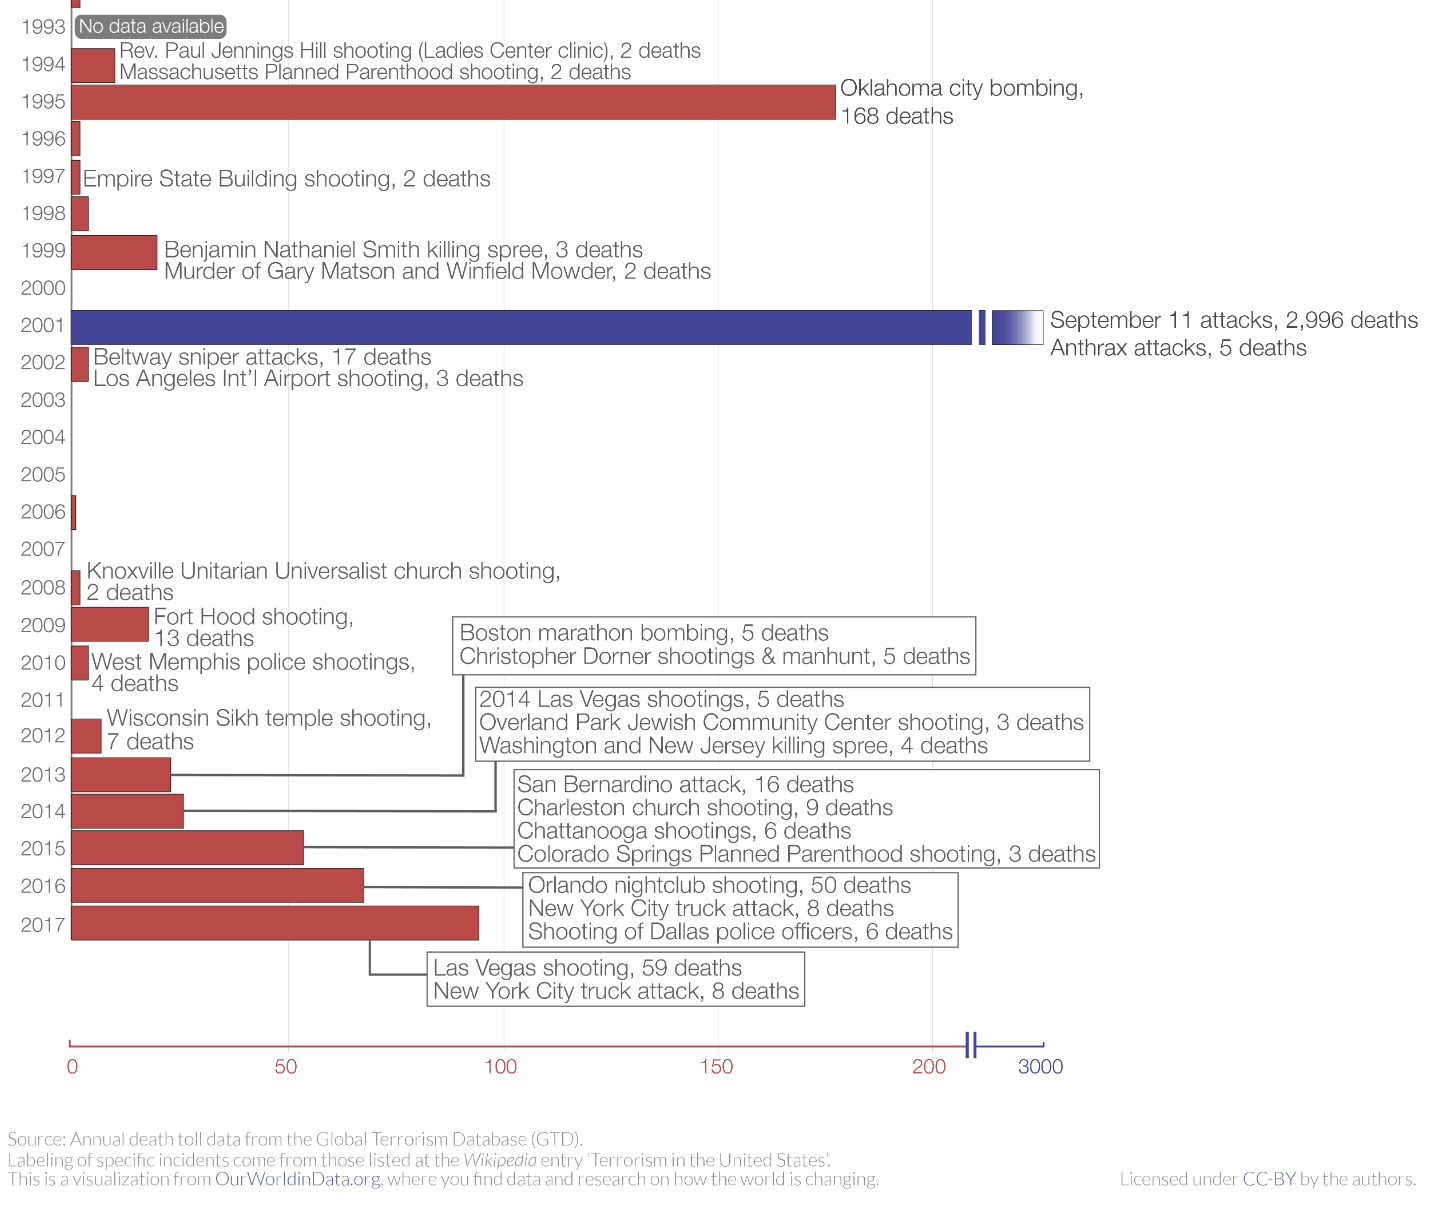 {max-width: 500px, display: block, margin: 0 auto} deaths by terrorist attack in USA
Compared to auto fatalities.
Car Fatalities
Motor_vehicle_fatality_rate_in_U.S._by_year:
Link to original
Year Deaths VMT– Vehicle miles traveled (billions) Fatalities per 100 million VMT Population Fatalities per 100,000 population Change in per capita fatalities from previous year 1999 41,717 2,691 1.55 272,690,813 15.30 Positive decrease-0.4% 2000 41,945 2,747 1.53 282,216,952 14.86 Positive decrease-2.9% 2001[2] 42,196 2,797 1.51 285,226,284 14.79 Positive decrease-0.5% 2002 43,005 2,856 1.51 288,125,973 14.93 Negative increase0.9% … … … … 288,125,973 14.93 … 2011[7] 32,479 2,950 1.10 311,588,000 10.42 Positive decrease-2.3% 2012[8] 33,782 2,969 1.14 313,914,000 10.75 Negative increase2.6% 2013 32,893 2,988 1.10 316,129,000 10.40 Positive decrease-3.3% 2014 32,744 3,026 1.08 318,860,000 10.28 Positive decrease-1.2% 2015 35,485 3,095 1.15 321,370,000 11.06 Negative increase7.6% 2016[9] 37,806 3,174 1.19 323,121,000 11.59 Negative increase4.8% 2017[9][10] 37,473 3,213 1.16 326,213,213 11.40 Positive decrease-1.6% 2018[10][11] 36,835 3,223 1.13 327,096,265 11.18 Positive decrease-1.9% 2019[12] 36,355 3,248 1.10 328,231,337[13] 10.99 Positive decrease-1.2% 2020[14] 38,824 2,904 1.34 331,449,281[15] 11.67 Negative increase7.1% 2021[16] 42,939[17] 3,230[18] 1.37 332,915,073[19] 12.89 Negative increase10.5% 2022[20] 42,795[21] 1.35 338,289,857[22] Positive decrease-0.3%